 |
 |
|
|||||
|
|||||||
 |
|
|
© 2006 Sacred Heart School. All rights reserved. Archdiocese of Kansas City in Kansas |
|
Market Survey & Demand Curve
Directions:
- Choose a product or service that you might want to sell in Mini Society. Describe it in detail. You may want to have a sample to display when you are surveying potential customers.
- Create a market survey and survey most or all of the people in your country. The market survey should have at least 5 or more prices for the same item, tallys for the number of that item that people would buy at each price, and a total for each price.
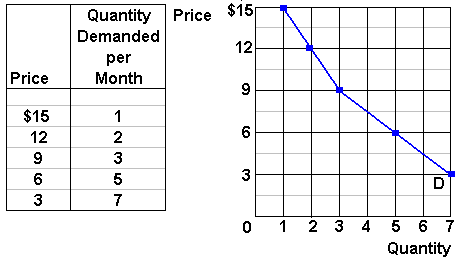
- From the results of your market survey, make a demand schedule. This is a frequency table that lists the prices and total demand for each price.
- Make a graph that shows the demand curve. This should be a single line graph that has the prices listed on the vertical (y) axis, and the amounts (quantity) that people would be willing to buy listed on the horizontal (x) axis. Be sure that your graph includes a title, scales, axes' labels, points, and a connecting line.
Sample Demand Schedule and Demand Curve Graph example, without title.

Scoring Rubric:
_______ /10 product description (item, size, color, flavor, etc.)
_______ /40 Market Survey (5 or more prices, tally marks, total quantity)
_______ /15 Demand Schedule (5 prices, total quantities)
_______ /35 Demand Curve graph (title, labeled axes, reasonable scales, points plotted, connecting curve)
_______ %
